Client

The customer is AsstrA-Associated Traffic AG, the world’s leading provider of logistics services, including air freight, sea shipping, railway transportation, road cargo transportation, etc. In addition, the company offers cargo insurance, product certification support, warehousing and integrated project solutions.
Founded in 1993, the organization has over 20 offices globally and operates in Europe, China, Middle Asia, Turkey, as well as in CIS countries.

Project goal

When AsstrA-Associated Traffic AG came to Arateg, reports and documents in various departments were kept in Excel spreadsheets. The organization lacked a unified data maintenance system which resulted in information inconsistency. Data search often consumed a lot of time. As a consequence, top managers were not able to effectively monitor logistics processes.
Cooperating with our UX design company, the client wanted to conduct business analysis and customer development to identify current challenges and possible solutions. build an all-in-one solution that would allow it to standardize reporting, unify data, as well as aggregate accurate information on potential orders, vendors, tenders, etc. The key objective was to conduct customer development and create UX design based on the research of the company's business needs.

Project summary

Project duration

1,5 months

Team

a UX designer, graphic designer.

Tools

user interviews, user personas, impact mapping, prototyping, design.

Solution

Our team delivered this project within 3 stages:
  • data collection and analysis
  • the creation of user personas and impact map
  • custom UX web design
To conduct customer development, we began by analyzing the client's business specifics and defining challenges. For this purpose, our experts hold 5 interviews with expeditors and department managers in the company’s offices in Poland and Belarus.
As their responsibilities were different (the main task of expeditors was to control transportation operations while department managers needed to monitor their work), our team prepared interviews accordingly.
As a result, we saw that processes in the company were similar while there were no clear standards for data management and making reports.
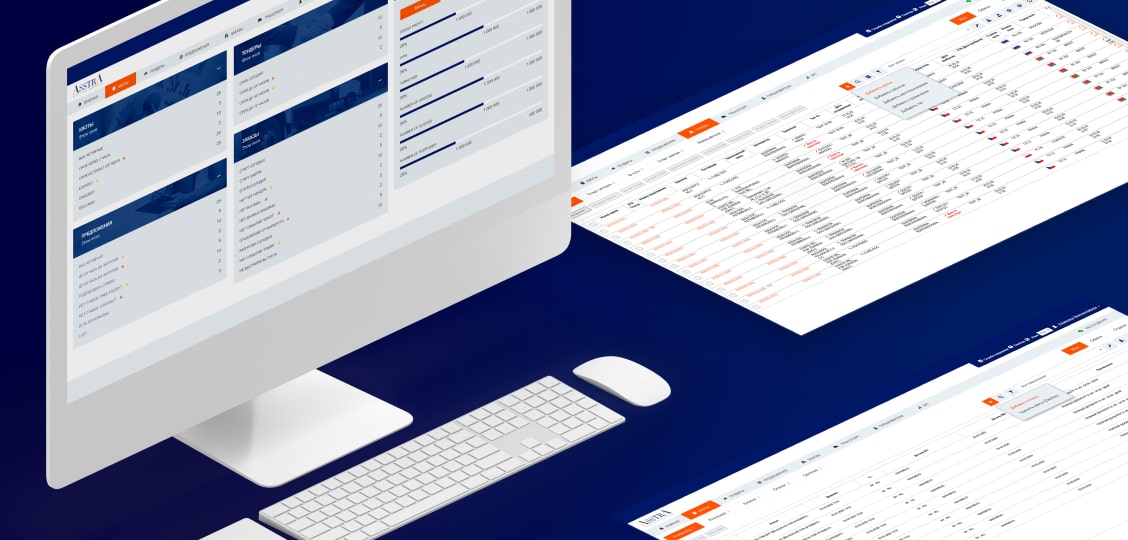
When the list of challenges was ready, we created impact maps and user personas for each role that described what expeditors and managers could do and decided to design a new Dashboard module for a customer inhouse portal.
For example:
  • an expeditor must be able to share a specific quota
  • an expeditor must be able to instantly find the required quota, etc.
Furthermore, we described in detail the tools that would allow them to perform the necessary actions. Based on our research, we defined the functionality to be built, prioritized features, and created a custom UX design, customizing it to the customer’s branding design scheme.
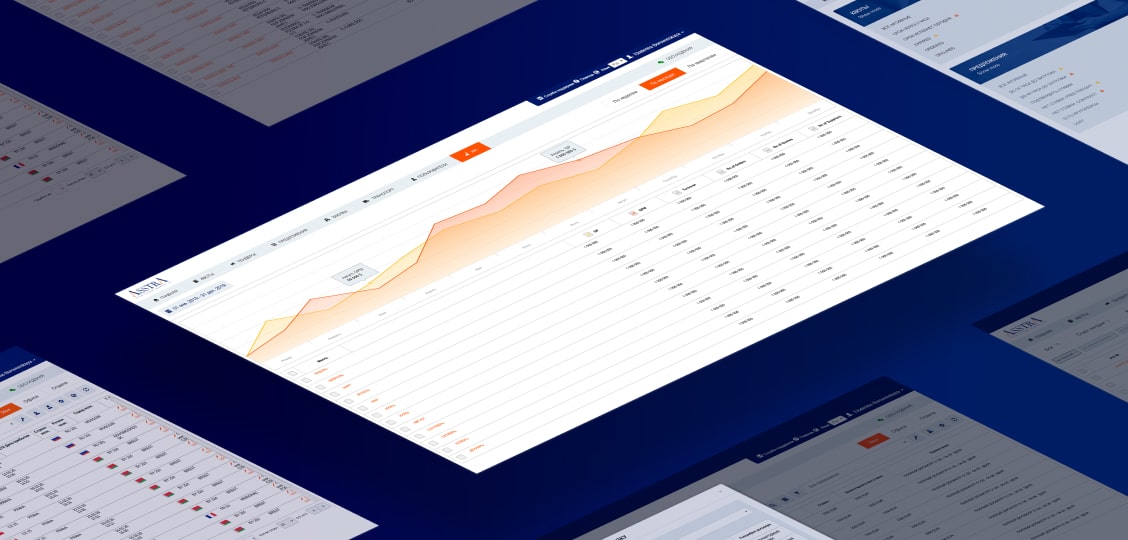
Since employees were keeping records in Excel spreadsheets using different colors for notes and task statuses, this caused confusion. To address this issue, our team recommended connecting colors with user accounts in the new Dashboard module. Aiming to ensure data consistency, we added statistics for department managers, data visualization, and the same tags for all the system participants.
case study, logistics dashboard development

The key features

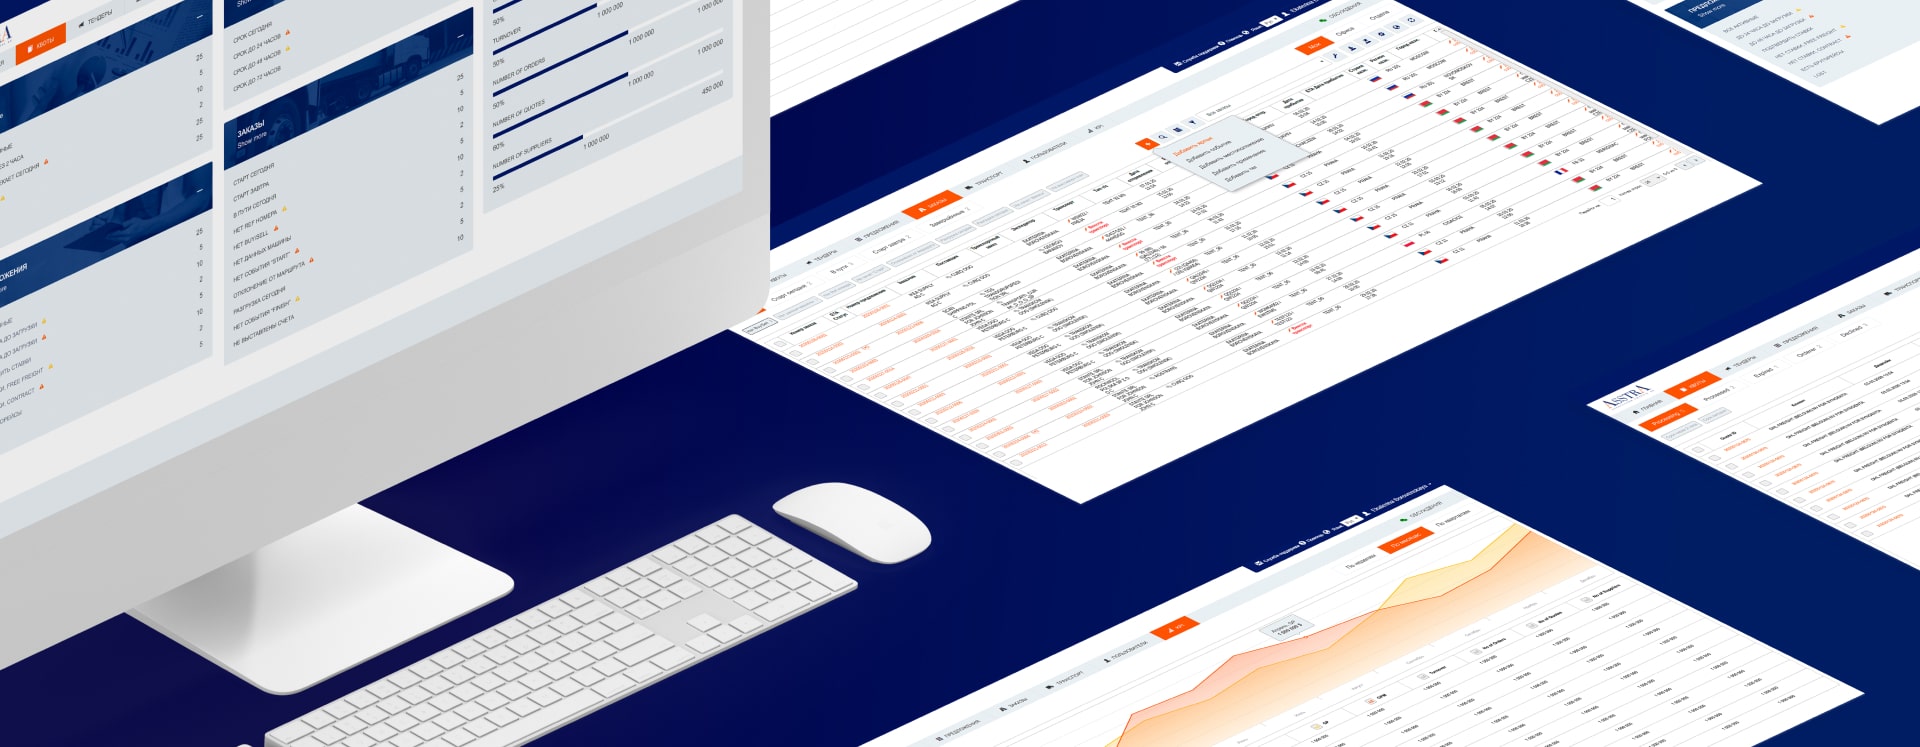
  1. New Dashboard sections for management of quotas, releases, KPIs, expeditors
  2. KPIs for different periods by the number of quotas, number of suppliers, margin, etc.
  3. KPI visualization according to different parameters such as income, turnover, the number of orders, the number of jobs, etc.
  4. The system for top managers to analyze the work of subordinates and visualize data
  5. Tags
  6. Labels
  7. Information search and filters
  8. The ability to make the required actions directly from the web system instead of going to the Oracle Transportation Management
case study, analytical dashboard development for a logistics company

Result

Using the delivered solution, AsstrA-Associated Traffic AG standardized reporting, provided data unification across various departments, and ensured data accuracy.
Collaborating with our UX design company, the customer simplified processes such as management of KPIs, tenders, vendors, quotas, and releases. With data visualization, the organization became able to easily monitor the logistics and transportation processes.

What AsstrA says

client review, Marina Syroezhkina from AsstrA
Marina Syroezhkina

Chief Information Officer, AsstrA

The new dashboard was successfully implemented and it met all of our requirements.

Arateg established a seamless workflow by communicating clearly and transparently. They also proved capable of providing innovative solutions in a timely manner.

More case studies you may like

We’d love to work with you

Drop us a line about your idea, project, or challenge.

We’d like to discuss how we can help you.
We’ll add your contact details provided in this form to our CRM to contact you regarding the request. For more information, please visit our Privacy policy.